Great Analysis Begins With Exceptional Data

Inseer’s in-depth reporting screens were developed by professional ergonomists – for ergonomists.
With editable risk thresholds and time cropping capabilities, our features highlight specific requirements of worker health analysis.
Report Comparisons
Easily compare reports side-by-side.
Compare the same task, performed at different times, by same worker, or different workers in the same video or in different conditions.
Open opportunities to validate impacts of corrective actions by your safety team by anazlyzing 3D data.
Continually improve by comparing worker shifts and workstations daily, weekly, and monthly to build a history. Utilize a historical database of reports for training purposes.
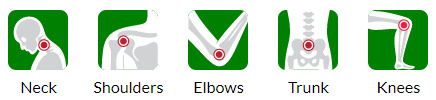
Selectable Data
Analyze and srill down into five types of data with video interpretation:
- Neck
- Shoulders
- Elbows
- Trunk, and
- Knees
For each body part you can measure joint angles, torque (force), speed, velocity and acceleration.

Video Display
Play, Pause, and Jump to a moment of interest.
Video playback is synched with the data for easy analysis. Select individual video frames using the video player or by interacting directly with the Waveform Analysis.
Toggleable Skeleton Overlay
This allows the user to show or hide the skeleton overlay.
Whether because of preference or to view obscured data, the user may hide the AI-projected skeletal overlay.
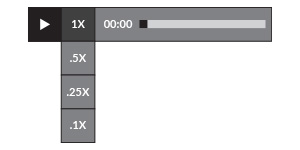
Slow Motion
Easily see and address problems.
With the touch of a button, our unique slow-motion feature means you can dissect a movement, observe changes, and assess risk from rapid movements at a workstation.
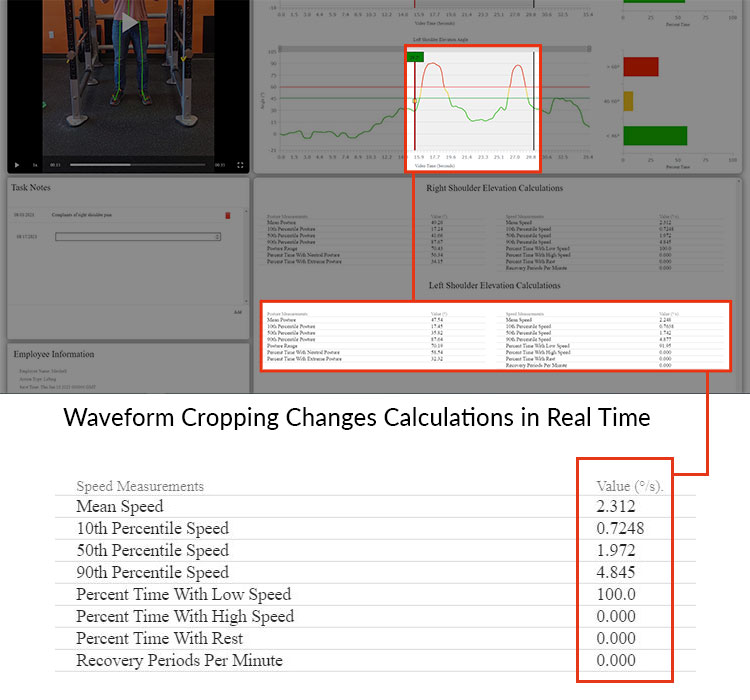
Waveform Analysis
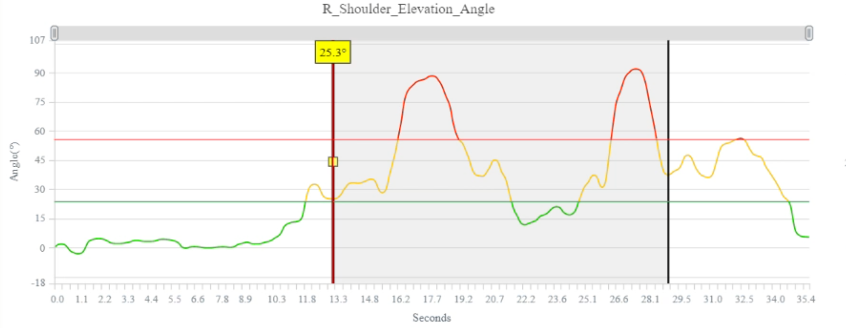
Waveform Graph
Graphs angles of body parts over time.
Instantly search and seek to a frame or sequence to isolate and focus on interesting movements to increase analysis accuracy, saving precious time isolating problems.
Focus, Zoom, & Crop Data
Easily zoom in on waveform data points by scaling the data using built-in sliders.
Crop and focus on specific durations to make detailed analyses of risk over time.
Risk Thresholds
Three levels of risk are associated to the data:
- High
- Moderate
- Low
Select your own acceptable range of motion to tailor analyses to your domain.
See a histogram of the percentage of time our subjects spend in each risk zone for quicker assessments.
Detailed Data Analysis
Conveniently gather detailed statistics in minutes, not hours.
Actionable information, both targeted or broad and for individuals or multiple subjects, is at your fingertips without needing any specialized computer infrastructure. Resulting ergonomic data is completely accurate and reproducible.
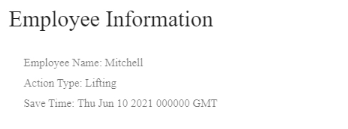
Employee Information
Readily associate your institution's employee data.
All employee information is securely and privately under your control.
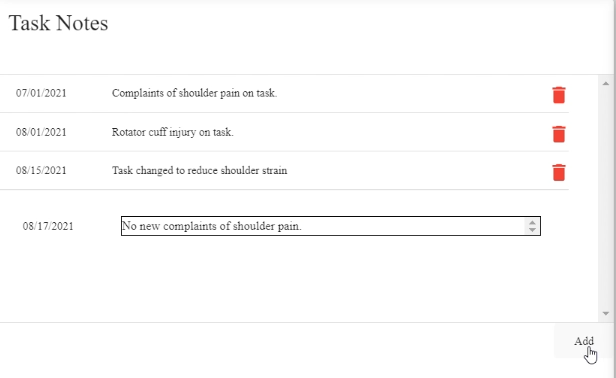
Task Notes
Quickly add, edit, and delete report notes.
Want To See More?
Contact us today for a live walkthrough of our state-of-the-art software.